RThe WDI package allows users to search and download data
from over 40 datasets hosted by the World Bank, including the World
Development Indicators (‘WDI’), International Debt Statistics, Doing
Business, Human Capital Index, and Sub-national Poverty indicators.
WDI is published on CRAN and so can be installed by
simply typing this in the R console:
install.packages('WDI')To install the development version of the package, use
remotes:
library(remotes)
install_github('vincentarelbundock/WDI')You can search for data by using keywords in WDIsearch.
For instance, if you are looking for data on Gross Domestic Product:
WDIsearch('gdp')Which produces this:
> WDIsearch('gdp')[1:10,]
      indicator              name
 [1,] "BG.GSR.NFSV.GD.ZS"    "Trade in services (% of GDP)"
 [2,] "BM.KLT.DINV.GD.ZS"    "Foreign direct investment, net outflows (% of GDP)"
 [3,] "BN.CAB.XOKA.GD.ZS"    "Current account balance (% of GDP)"
 [4,] "BN.CUR.GDPM.ZS"       "Current account balance excluding net official capital grants (% of GDP)"
 [5,] "BN.GSR.FCTY.CD.ZS"    "Net income (% of GDP)"
 [6,] "BN.KLT.DINV.CD.ZS"    "Foreign direct investment (% of GDP)"
 [7,] "BN.KLT.PRVT.GD.ZS"    "Private capital flows, total (% of GDP)"
 [8,] "BN.TRF.CURR.CD.ZS"    "Net current transfers (% of GDP)"
 [9,] "BNCABFUNDCD_"         "Current Account Balance, %GDP"
[10,] "BX.KLT.DINV.WD.GD.ZS" "Foreign direct investment, net inflows (% of GDP)"
WDIsearch uses grep and ignores cases, so you can also
use regular expressions. For instance, if you are looking for GDP per
capita in constant dollars:
WDIsearch('gdp.*capita.*constant')
     indicator           name
[1,] "GDPPCKD"           "GDP per Capita, constant US$, millions"
[2,] "NY.GDP.PCAP.KD"    "GDP per capita (constant 2000 US$)"
[3,] "NY.GDP.PCAP.KN"    "GDP per capita (constant LCU)"
[4,] "NY.GDP.PCAP.PP.KD" "GDP per capita, PPP (constant 2005 international $)"
Download a series you like for the countries you like:
dat = WDI(indicator='NY.GDP.PCAP.KD', country=c('MX','CA','US'), start=1960, end=2012)Look at the data:
head(dat)
  iso2c country NY.GDP.PCAP.KD year
1    CA  Canada       9374.883 1960
2    CA  Canada       9479.824 1961
3    CA  Canada       9967.366 1962
4    CA  Canada      10290.362 1963
5    CA  Canada      10774.653 1964
6    CA  Canada      11283.606 1965
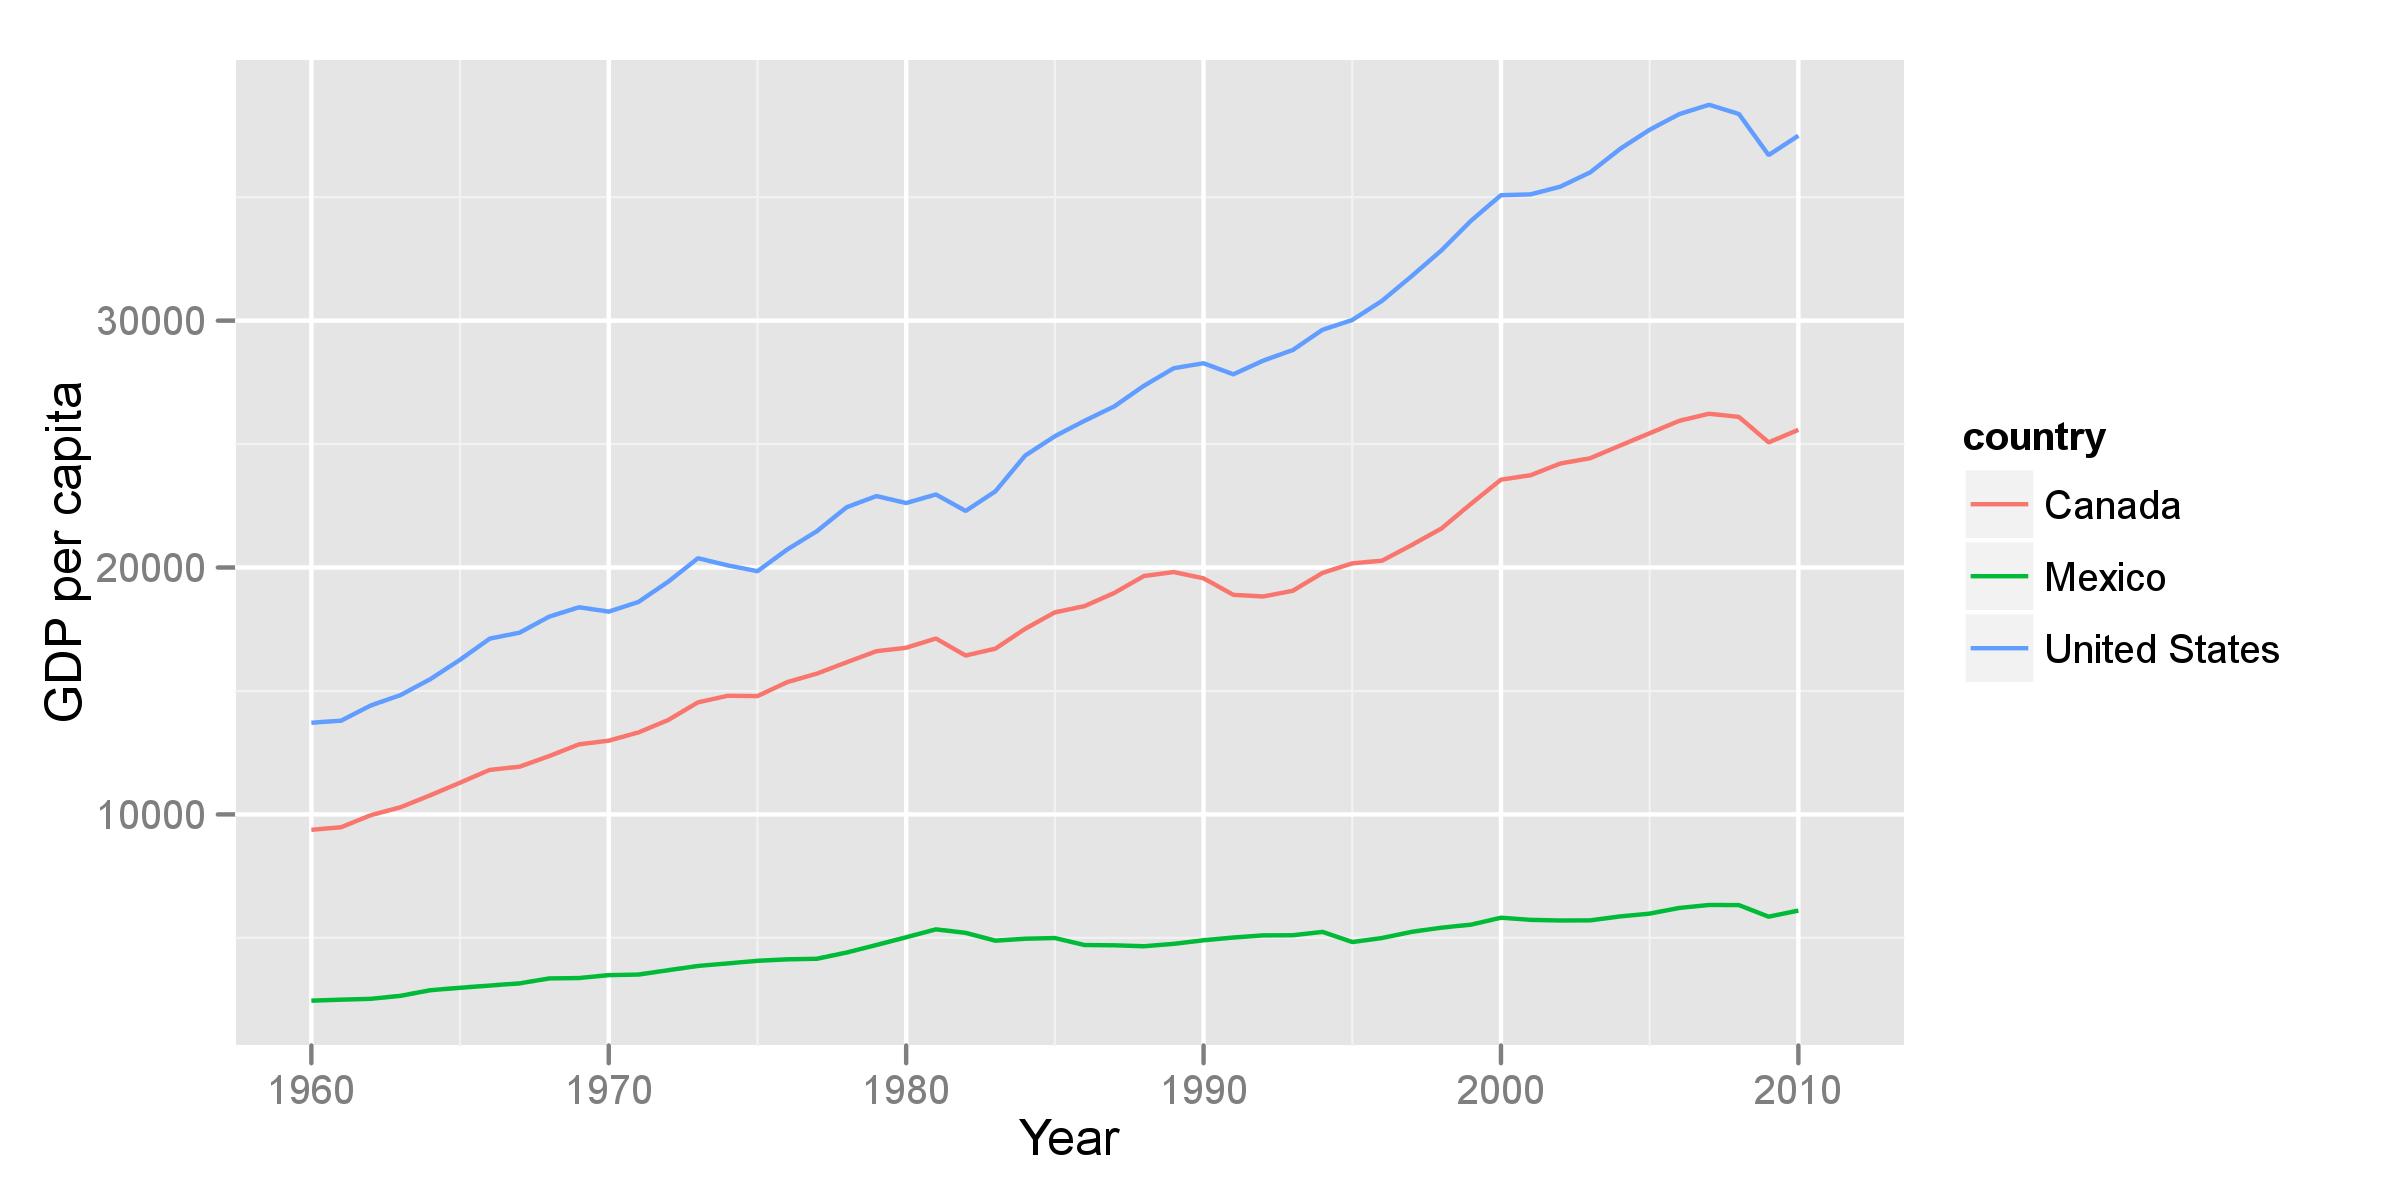
Plot the data:
library(ggplot2)
ggplot(dat, aes(year, NY.GDP.PCAP.KD, color=country)) + geom_line() +
    xlab('Year') + ylab('GDP per capita')
Note: You can use country='all' to download data for all
available countries. You can also feed a vector of indicator strings if
you want to download multiple indicators at once.
Some World Bank series are available at the monthly or quarterly
frequency. You can download those simply using the start
and end arguments:
WDI(indicator = 'DPANUSSPB', country = 'CHN', start = '2012M01', end = '2012M05')

  iso2c country DPANUSSPB    year
1   CHN   China  6.324130 2012M05
2   CHN   China  6.303810 2012M04
3   CHN   China  6.313545 2012M03
4   CHN   China  6.300286 2012M02
5 CHN China 6.313091 2012M01If the vector that you supply to WDI is named, the
function will automatically rename columns where possible.
dat <- WDI(indicator = c("gdp_per_capita" = "NY.GDP.PCAP.KD",
                         "population" = "SP.POP.TOTL"))
head(dat)
iso2c    country year gdp_per_capita population
1    1A Arab World 2005       5378.379  316264728
2    1A Arab World 2006       5594.899  323773264
3    1A Arab World 2007       5711.663  331653797
4    1A Arab World 2008       5898.516  339825483
5    1A Arab World 2009       5782.422  348145094
6 1A Arab World 2010 5916.330 356508908To speed up search, WDI ships with a local list of all
available WDI series. This list will be updated semi-regularly, but you
may still want to update it manually to get access to the very latest
data series. To do so, use the cache function:
new_cache = WDIcache()
WDIsearch('gdp', cache=new_cache)Thanks for using WDI! Please send all bug reports and
suggestions through the github issue tracker or by email to
[email protected]